Sitting on a bench at a friend’s house in Brest, France, I look at the windy landscape and think of triangles and kebabs - a strange combination of thoughts, I know, but its origin can be found in the last events of my life, as you will soon understand.
I have spent the last two weeks in my first European travel experience and it seems that I’ve been far from home for a long time. Not because it hasn’t been a good experience or something like that, but simply because so much has happened that time is slowly passing by. I have been to the Swiss Alps driving in its curly roads of perfect tarmac and glorious mountains. Sometimes icy tongues of sliding glaciers would fall free from the top of the mountains; sometimes the mountain would bar its progress letting escape just a thin cascade of transparent green water. I have been to Switzerland’s most prominent mountain – the Matterhorn – also known as Cervin or Cervino…. in any language a queen mountain of great beauty, the mountain that my father has always wanted to climb and that I hope one day I will. I have slept in a peaceful German-speaking hotel before the Furka pass, just to be cursed out by an Italian old man a few kilometers to the east in the other side of the mountains in the following day. I got almost drunk with crazy Italians in Orvieto – a medieval town north of Rome – and the following day, after eating a “prosciutto” pizza in the mountain town of Norchia, I was wetting my feet in the Adriatic Sea, near St. Benedeto. I walked by the ruins of ancient Rome and marveled at its grandeur, but with the feeling that they were like animals in a zoo, with its natural beauty taken away by protecting cages and tourist cameras.
I have done lots of great things in these few days and seen wonderful natural and man-made landscapes, but what really fills my mind (and heart) right now are the very first events, that happened in the fairy-tale city of Zürich. There, little more than a handful of leading researchers in the field of Geomorphometry, together with a few more eager-to-learn Ph.D. students, got together to make wonderful science. I am a Brazilian oceanographer who had the honor to participate in such an event and would like to share with you my happiness for having done so.
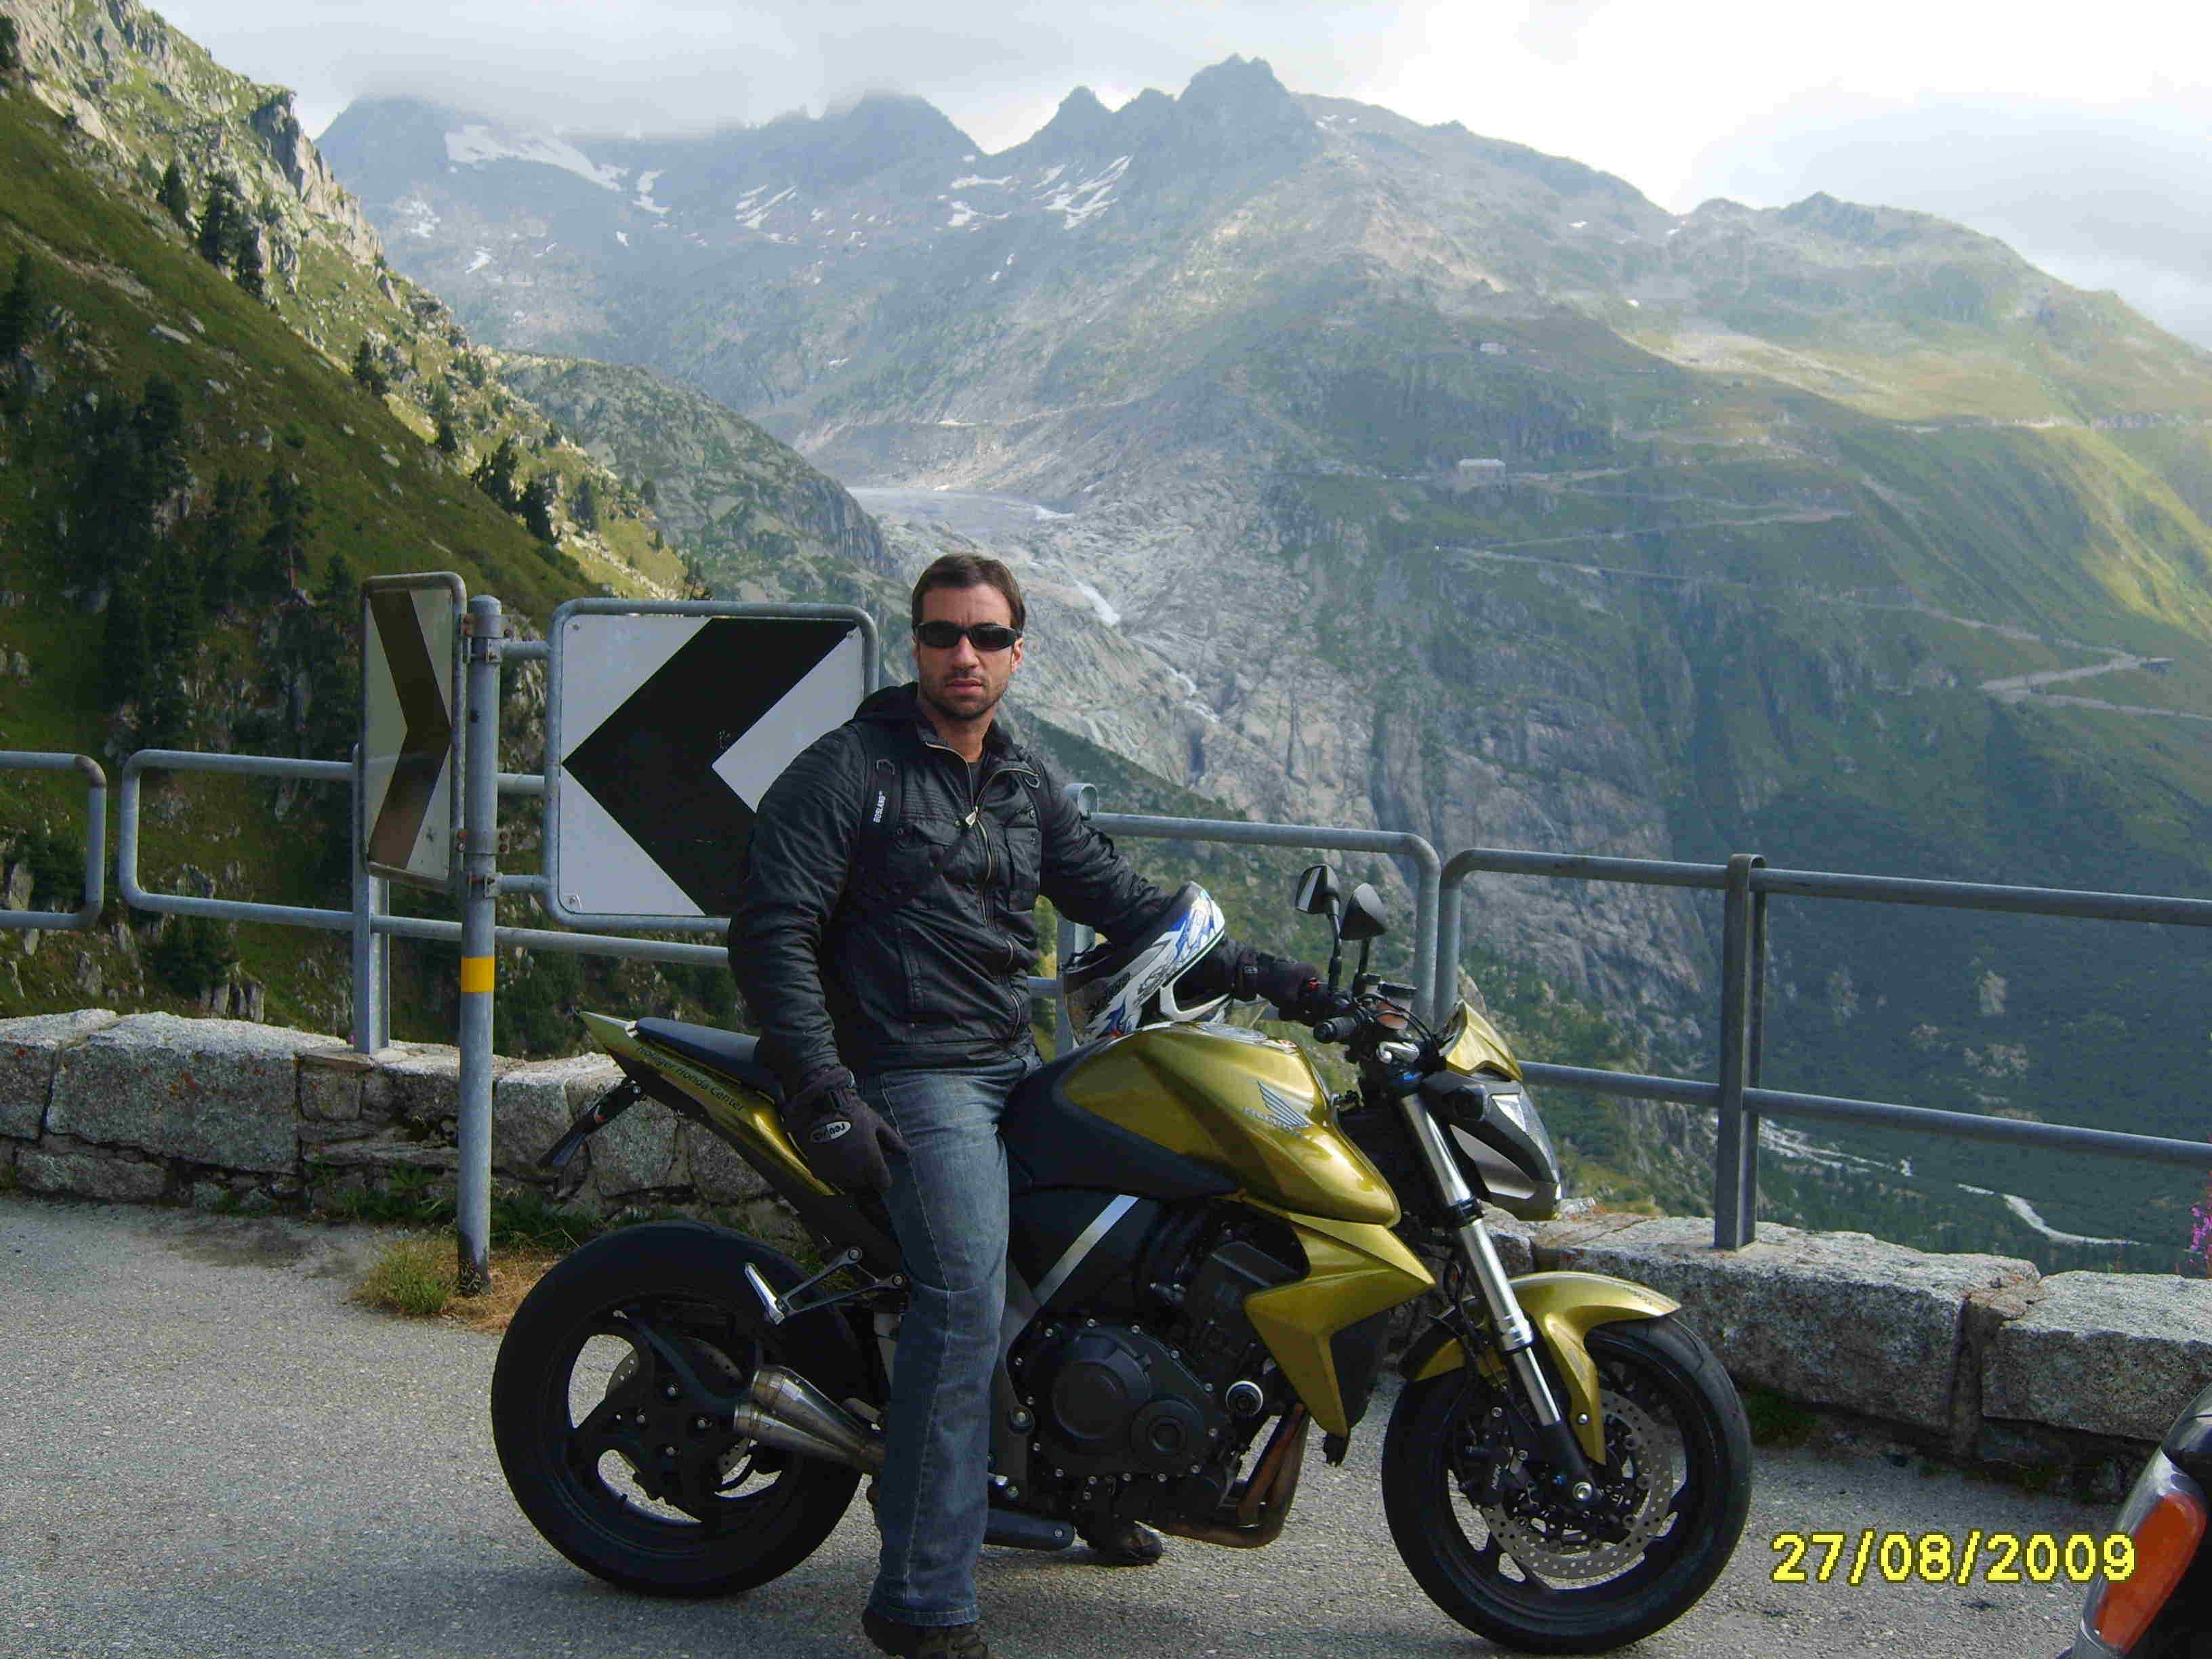
Fig: Perfect roads and glorious mountains. What a beautiful country!
The definition of Geomorphometry is the science of quantitative land-surface analysis (Pike, 1995, 2000a; Rasemann et al., 2004) but I like to think of it as the discipline of Geomorphology after most of its subjectivity is replaced by reproducible mathematical descriptions of the landscape with the help of computer technology. It is an interdisciplinary field of unique beauty, which allows one to look at the three-dimensional landscape and to see it in a multi-dimensional space far richer in information than the eyes alone could ever capture.Both the ability of the human eye to capture form and the dimensionality of datasets and methods received much attention in these three days of conference and scientific talks about geomorphometry, so much that I am unable to address all that has been said. Actually, a long time will be necessary for all the new information that I have listened is processed and organized in my brain in such a way that it can eventually become real knowledge. Even so, I would be glad to paint you a rough picture of what it was, hopefully, without making too many mistakes.
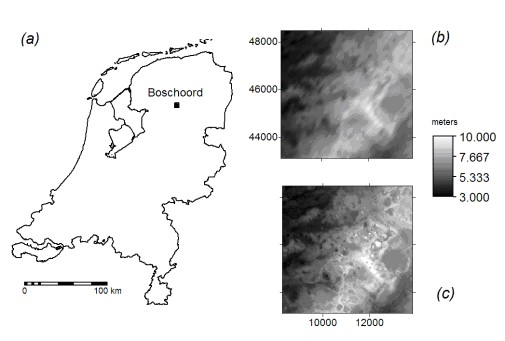
Geomorphometry 2009 began with two workshops of very different flavors. Back to reality – Reconciling geomorphometry and geomorphology in the field was a delightful field trip to a forested area near Zurich called Sihlwald, when people actually measured the landscape and compared the field-derived data to a high-resolution LIDAR dataset for the area. Oliver Korup (WSL, Switzerland) moderated the workshop and led the participants to an in-depth discussion of the pros and cons, as well as the potentials of LIDAR-based geomorphometry. Automated analysis of elevation data in R+SAGA/GRASSwas the other workshop which focused in the use of open source software packages to process elevation data. Unfortunately, the workshops were run in parallel and I could not attend both, so I decided to be more objective and try to learn some scripting since that is what I intend to do most from now on. I had to content myself in appreciating Switzerland’s marvelous landscapes through my untrained eyes.
This is when I must talk a little bit about triangles, which explain part of the weird title of this text. Actually, it is a happy triangle. Tomislav Hengl (University of Amsterdam) and his colleague Carlos Grohmann (a Brazilian like me, but – poor guy! from São Paulo) were my teachers in the ways of the happy triangle which consists of a suit of softwares for complete analysis of Digital Elevation Models (DEMs), the basis for any geomorphometric analyses.
The topmost vertex of the triangle is a statistical computing software called R which acts as a core software from which you can control all the others deciding how to distribute the analyses and how to run operations. It also provides a robust way of assessing accuracy and quality of the analyses carried out through statistics. In another vertex of the triangle lies the combination of two leading GIS software available freely in the web: SAGA and GRASS. Both programs have amazing functionalities with respect to DEM pre-processing, morphometric and terrain analyses, hydrology and much more. There was an undeclared context running (not really undeclared) in the background of the workshop between the SAGA man (Tomislav) and the GRASS man (Carlos). The result of this unfair challenge (Brazilians “naturally” tend to overcome Croatians) was a lot of knowledge being passed open-heartedly to the participants with the clear intention of diffusing it so that it can progress. The last vertex of the triangle was Google Earth, a very well-know GIS platform for visualization of spatial data that represents the output of the triangle.
The students differed in reaction: some followed with great ability the scripts and enjoyed the experience; others were a little frightened by the not-so-user-friendly GRASS and yet others were concerned by R (“R-Inferno” for some). I, myself, tried to disguise my fear of not accompanying the class blaming my 64-bit computer and eventually asking my friend Thomas (great “streams have two sides” guy) for help. But one thought, I believe, populated everybody’s minds while we savored some sausages with beer in our last-day barbecue: “This triangle is indeed a happy one!”
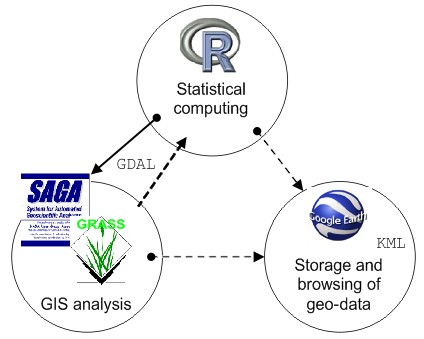
Fig: The Happy Triangle.
The first day of conference began with Ross Purves (University of Zurich) welcoming us all in his Scottish way (wearing shorts that pleased everybody for the informality) and presenting the first talks. Ralph Straumann was the first to speak and I was really glad to watch him argue that before applying any of the numerous algorithms available for extraction and classification of landforms (or landform elements), one should first strengthen the ontological basis of such approaches and review aspects such as breadths, properties and interrelationships of landforms. The idea that even the concepts of continental landforms are still bound to controversies gives me an ease of mind to address the even less clear landform-related domain knowledge of marine geomorphology.
Tomislav then formalized the SAGA/GRASS context by presenting a comparative analysis of both software based on objective and subjective criteria, including user’s satisfaction following questionnaires that we answered just the day before. Despite some clear differences between both softwares, I would say that the actual winner of the context was the scientific community, which has been experiencing a boost over the last few years with respect to the use of high-quality open source GIS, and can count on both SAGA and GRASS for state-of-the-art geomorphometric analyses.
After our first coffee break, Ian Evans (University of Durham) kept on introducing the next presenters which showed methodological developments concerning hydrological and viewshed analysis. I could do little more than admire what was being presented, but I could not help noticing the child-like excitement of John Gallant (CSIRO) presenting his (and Hutchinson’s) differential equation for specific catchment area. It is amazing how these men can dedicate their lives for so long to geomorphometry and still retain so much enthusiasm for it. I just hope it is the same with my not-too-far-in-the-future married life.
After lunch, Ian Evans introduced (not really necessary) the first keynote speaker of the conference – Jo Wood (City University London). Well, at this moment, despite the alkaline tide that was forming in everybody’s blood after meal, I can guarantee that no one had their eyes closed. Mine were wide open, just as my mouth was. Jo gifted us with a presentation that I remember more as a science fiction movie full of special effects. Concepts such as information visualization, visual analytics, information and visual scalability, and even human scalability, were introduced in a way that not only provoked us, as Ian Evans said he would, but also immersed us in a kind of flash forward of geomorphometry.
After that, still feeling a little dizzy from Wood’s visions, we were presented with some very interesting object-based approaches for the extraction of landform elements. This is a rather recent field of geomorphometry which has been receiving increasing attention as higher resolution datasets become available and individual pixels have diminishing importance when compared to larger segments that can be more easily associated to geomorphologically significant landform elements. Many of us were particularly impressed by the computational simplicity and geomorphological content of Bård Romstad’s (University of Oslo) presentation of his (and Etzelmuller’s) methodology based on watershed segmentation of curvature.
After the coffee break, things got really rough for me in this last session of presentations concerning soil mapping. Not only this field of knowledge isn’t really a part of oceanographic studies, but also my apprehension with respect to the first talk of the next morning (MINE!) was getting uncomfortably high. I remember lots of statistics, object-based segmentation and classification (very interesting for my ongoing studies), an extensive revision of soil maps… all that in the middle of a cloud of thoughts such as “These guys know too much what they are talking about; I think I should just get a couple of (dozen) beers and inadvertently get the nearest tram to Brazil”.
Well, I didn’t quite do that, but I did have a couple of beers with my Belgian friend Nicolas who introduced me to my first kebab ever, but not without conveniently forgetting to tell me how hot it was. So, in a tentative way of putting down my fire, I tried to taste the local Swiss delicacies (with questionable success) and then went to the hotel admiring the cool air that came from the lake and resembled the calm before the storm.
When I went to the front row of the conference room the next morning, I was welcomed by John Gallant in such an easygoing way that I got relaxed instantaneously. To see all those prominent researchers in front of me with really interested faces waiting for my words made me realize that I was there for some reason: something in my work had captured their attention way before when they accepted my paper to be presented and now I had only to tell them what I knew by heart. And I tried to do that as passionately as I could, valuing the historical effort of those who preceded me for more than half a century in ocean mapping and understanding. Then I showed a simple methodology for the physiographic classification of the ocean floor using geomorphometry. I told them a story I think they liked… and I was happy.
My presentation was part of the Global-Scale Geomorphometry session and Peter Guth (US Naval Academy) followed showing his famous Global Geomorphometric Atlas and I was honored to open the show for him (you know, like that really obscure band that plays for 30 minutes before the flabbergasting 2-hour show by a mammoth group like the Rolling Stones, U2 or Pink Floyd). His linear sand dune recognition methodology initiated a series of discussions with respect to applications of SRTM data and was closely followed by Hannes Reuter who amused us when he told he was about to begin a geomorphometric atlas when Peter Guth simply did it all by himself before.
After the coffee break, Jo Wood was the obvious choice to moderate a session regarding multiscale methods in geomorphometry. I am particularly fond of this subject and it was a real pleasure to see Katherine Arrell (University of Leeds) talking about scaling trends (or scale tendencies) of surface roughness to characterize landscape types. The advantages of wavelet analysis compared to classic Fourier analyses, explained by Michael Kalbermatten (Ecole Polytechnique Fédérale de Lausanne) as due to the more localized information-content, also interested me very much in spite of my limited understanding (what a euphemism!) of the mathematical theory involved. Lucian Dragut (University of Salzburg) followed with a thorough assessment of different ways to incorporate scale in geomorphometry. He also made the terrible mistake of giving me his professional card which I will use to disturb him with my endless questions regarding this matter before he finally realizes that and changes all his contact details. After that, my friend Carlos did a great job analyzing different measures of surface roughness of topography. The last comparative graph he showed was particularly elucidative (I wonder how long you took to do that, huh?).
We then had lunch and, after that, the terrible sin of envy almost disarranged my stomach. We had an industrial keynote by Stephan Landtwing (BSF Swissphoto), a key producer of LIDAR data in Switzerland. The only thing I want to say about that is that in my work I used a dataset with a cell size of 3700 meters while you lucky guys have at your disposal at least 1 meter resolution LIDAR datasets. This means that for every single elevation information I get for the ocean floors, you have 13690000 data points with LIDAR. Enough said about that…
Hannes Reuter, of course, presided over the next session regarding data considerations. Trying (unsuccessfully) not to sound too fond of John Gallant’s work, I must say that I was really impressed by his (and his colleagues’, locked in that small room back in Australia) methodology to enhance SRTM data for Australia (which is already much better than in any other place…lucky them!). I could see in this session how you all treat with such detail the quality of the data you use and that is a lesson I will definitely take home for my new investigations of ocean topography.
My friend Nicolas Sougnez (University of Louvain) began the next session with a geologically intense presentation of channel and slope morphology followed by unique geomorphological applications regarding fitting scoria cones for morphometric analyses and landslide stability models. I must confess that my mind was beginning an auto-fagocitosis process after trying for so long to grasp all that was being presented in those two days of conference plus two days of happy triangle. My blood was getting too thick and I simply needed a beer (or two – or rather, a dozen) to lighten up my mind. Thank the gods it was Conference Dinner time!
I was beginning to feel afraid when after taking a tram up a cliff, and walking for more than ten minutes, I still could not see any sign of beers and someone began talking about the rain forecasted for the night. Was Ross Purves guiding us for a stroll through the park or for a restaurant to get some real food? Thankfully it was the latter and we had a great dinner regaled with beer and wine. There was even a Portuguese waitress who kept filling my glass of beer (no complaints there). When Ian Evans and Tom Hengl called for attention and said, among other beautiful things, what a perfect meeting that was, I knew that it was a rare and special occasion and I felt very lucky to be part of it. My Austrian friend Markus (University of Innsbruck) lit a cigarette and I thought - “Why not?” - And on we went smoking our cigarettes, talking about life and having a really good time among great people.
Now I should begin talking about the last day of conference… but the night would not end. After the rain began, half the people went away and the other half pursued more beers being guided by my Swiss friend Mathias from the WSL Institute (which later acted as my personal photographer – thanks, man!). Well, from now on, time began to accelerate and I began doing this “round-by-round” way of drinking with these Aussie guys (my friend Brendan from the University of Sydney included) who wouldn’t stop drinking. The group divided itself again and, of course, I stayed with the portion that was still chasing more beers….or something else. Well, the night accelerated again and, when I woke up, I was late and all I could think was my Dutch friend Roderik (Delft University of Technology) presenting his Martian morphology classification without me there to watch (he was the second to present that morning). I don’t know if he would really care, but he comes from a Viking lineage, so I really did not want to risk crossing him. I ran to the university and could still watch half of Tomasz Stepinsky’s (Lunar and Planetary Institute) presentation. It was a pity to miss the other half since I like very much these extraterrestrial approaches (specially his papers), but at least I could watch the fancy movie Roderik presented and, as a reward for my effort, he loaded my GRASS with the entire MOLA DEM. I was really thankful and happy about it. I must confess that while Balazs Szekely (Vienna University of Technology) was presenting a very interesting methodology for extraction of Martian talus slopes, I was playing around with 3D visualizations of Mount Olympus and Valles Marineris. Sorry for that!
After the coffee break, the most difficult part of the conference with respect to my understanding began, so I will be really brief so as not to insult my colleagues with stupid assertions about their work.They talked about water and then ice. That’s it: I can’t be wrong if I stick to just that, can I?
Well, OK, let’s try to do better than that, especially because my friends Nathalie and Laura would be mad at me if I didn’t. Paolo Tarolli (University of Padova) presented with his strong and pleasant Italian accent (I wonder how mine sounds) a very important analysis of cell size dependence in threshold conditions for the delineation of drainage networks. I believe that is the kind of work that everybody is a little lazy about doing, but which is so essential to proper extraction of landforms. Another thing I remember of Paolo was his comment after a previous presentation that he had found that sometimes a lower resolution is more adequate for some studies than the full resolution of LIDAR data. This was an interesting topic in this conference, but what I would like to say now is something else. I remember thinking that when Paolo talked about that fact, he was clearly expecting that some discussions and brainstorms would follow, which did not. Naturally, there was no time for such things and I am sure he understood that immediately, but that could be a suggestion for new editions of Geomorphometry – more time for discussions. I would really enjoy watching all these researchers in a ferocious discussion about anything – I am sure many ideas would flourish.
My French friend Nathalie Thommeret (CNRS) followed presenting her (and Bailly’s and Puech’s) algorithm for extraction of thalweg networks and I remember Bob Macmillan (ISRIC) complimenting her work, which, I am sure, was really deserved and made her proud. She was a bit nervous in the preceding moments of the presentation, but I believe she took my advice and had a couple of beers to calm her down, because her presentation was great! More analyses of initiation thresholds with respect to DEM resolution followed with Ashraf Afana’s (Arid Zones Research Station) presentation (this seems to be a really hard issue in hydrology). Then came my pit-removing Italian friend Laura Poggio (The Macaulay Institute Aberdeen) who had only one regret in this conference: meeting me. Since I don’t really understand anything about filling, carving and optimal hybrid algorithms for pit removal I must state a question right now: is it prohibited to drink coffee in the buses in Zurich? Well, I hope it is because she made me throw away all my coffees before taking the buses from our hotel, so if I slept in any of the presentations, it is her fault.
Our post-lunch keynote was a profound talk by David Mark (University at Buffalo). Few talks made me think so much. What he and Mr. Straumann in the beginning of the conference said about ontology made me realize that this must be my next step in the search for a proper methodology to map the ocean floors: I must question very much the ontological nature of oceanic landforms prior to any attempt at extracting them from DEMs. Most of the physiographic knowledge of the ocean floor has been immutable since decades ago and I wonder if questions concerning what entities really exist, or if they can be grouped or if they are related to one another, are really being asked nowadays? The increasing availability of high-resolution datasets makes it irresistible to go deeply into the details of geomorphology, but are we losing the big picture? I feel that I still have much to learn from global scale geomorphometry and I believe now that if I ask the right questions keeping ontology in mind, I will eventually get to smaller-scale studies with a much more thorough understanding of marine landforms (could we say seaforms or oceanforms?).
Hydrologic talks continued to hammer my tired mind with another GRASS guy’s work –Markus Metz (German Primate Center). I remember seeing some very good results of his (and Mitasova’s and Harmon’s) new implementation of hydrologic analysis based on a least-cost path algorithm, however, my capacity of comprehension was really diminishing with the looming end of the conference. It is impressive how tiring can it be just to think, even in a comfortable seated position.
The last session of the conference came with a subject at which we Brazilians are experts: Glaciology! Well, the closest I got to glaciological studies in my life was the first and only time I practiced some snowboarding in Chile. After a very “clever” manoeuvre, I turned sideways in the track and buried the side of the board in the snow. This made me somersault and hammer my face in the ice right before the board came crashing on my skull, making me roll into the powder snow off-piste. That episode gave me seven stitches and all the knowledge I have of glaciology: ice is hard and snow is soft.
Anyway, I watched Andreas Linsbauer’s (University of Zurich) neatly named presentation “The Swiss Alps without Glaciers” thinking of Ian Evans’ comment to me two days before about simulating ice over Rio de Janeiro’s mountains. A beautiful name for this unique paper could be “Rio de Janeiro WITH Glaciers: A GIS-based Modelling Approach for Destruction of My Carnival”. Not a very good thought.
Speaking of the Devil, Ian Evans followed, teaching us allometric considerations in specific geomorphometry. Allometry was a new and very interesting concept for me, but to listen to Evans pontificate about general and specific geomorphometry, concepts that have always guided me in my studies, was a pleasure on its own (so I had to film it). Regula Frauenfelder (University of Zurich) then had the honor to close the presentations with a very fine and visually appealing presentation regarding morphometric modelling of rockglaciers.
Well, the conference finally came to an end and awards for best paper and best PhD student presentation were given by Ian Evans and Tom Hengl. John Gallant (very deservedly) received the best paper award, which I am sure is not an uncommon situation in his life, and the best student presentation award was given to me. I must say that it was such a pleasant surprise that it took me a while to realize that Tomislav was calling my name. I made a huge effort to be in Zurich for this conference, but that moment alone rewarded me in a complete way and will stimulate my studies for a long time. Sure, the knowledge contained in the book they gave me will teach me for years to come, but what will really keep me going during the hard moments are the autographs in the counter-page. I thank them with all my heart.
To finish this manuscript, I would like to describe a brief and simple moment regarding a kebab. After the conference was over, me and my friend Nicolas went to have a kebab and beer in celebration of all that had happened. When we were almost finishing, Lucian Dragut appeared and after noticing our presence, came to join us. We had another beer while talking trivialities and a little of geomorphometry and, despite being tired, it was a very relaxing moment. Then someone called him on the phone and he gave some directions to the kebab place so that the other people, who seemed to be drinking somewhere else, could join us. A few moments passed and a very distinguished figure appeared wearing a beige suit and a nice “geographical” tie: it was Ian Evans.
He did exactly the same thing as Lucian and sat down to have a kebab and a beer and began talking with us. He talked about his late mother, who passed her last years in a care home with local staff, which is increasingly unusual as many care staff speak a different language and have different backgrounds. His mother was happy eating what she had eaten for decades, with staff who understood her.
After a few moments of pleasant conversation, I noticed my exhausted Belgian friend and decided to call it a night. I shook their hands and left for my hotel after a goodbye hug from Nicolas.
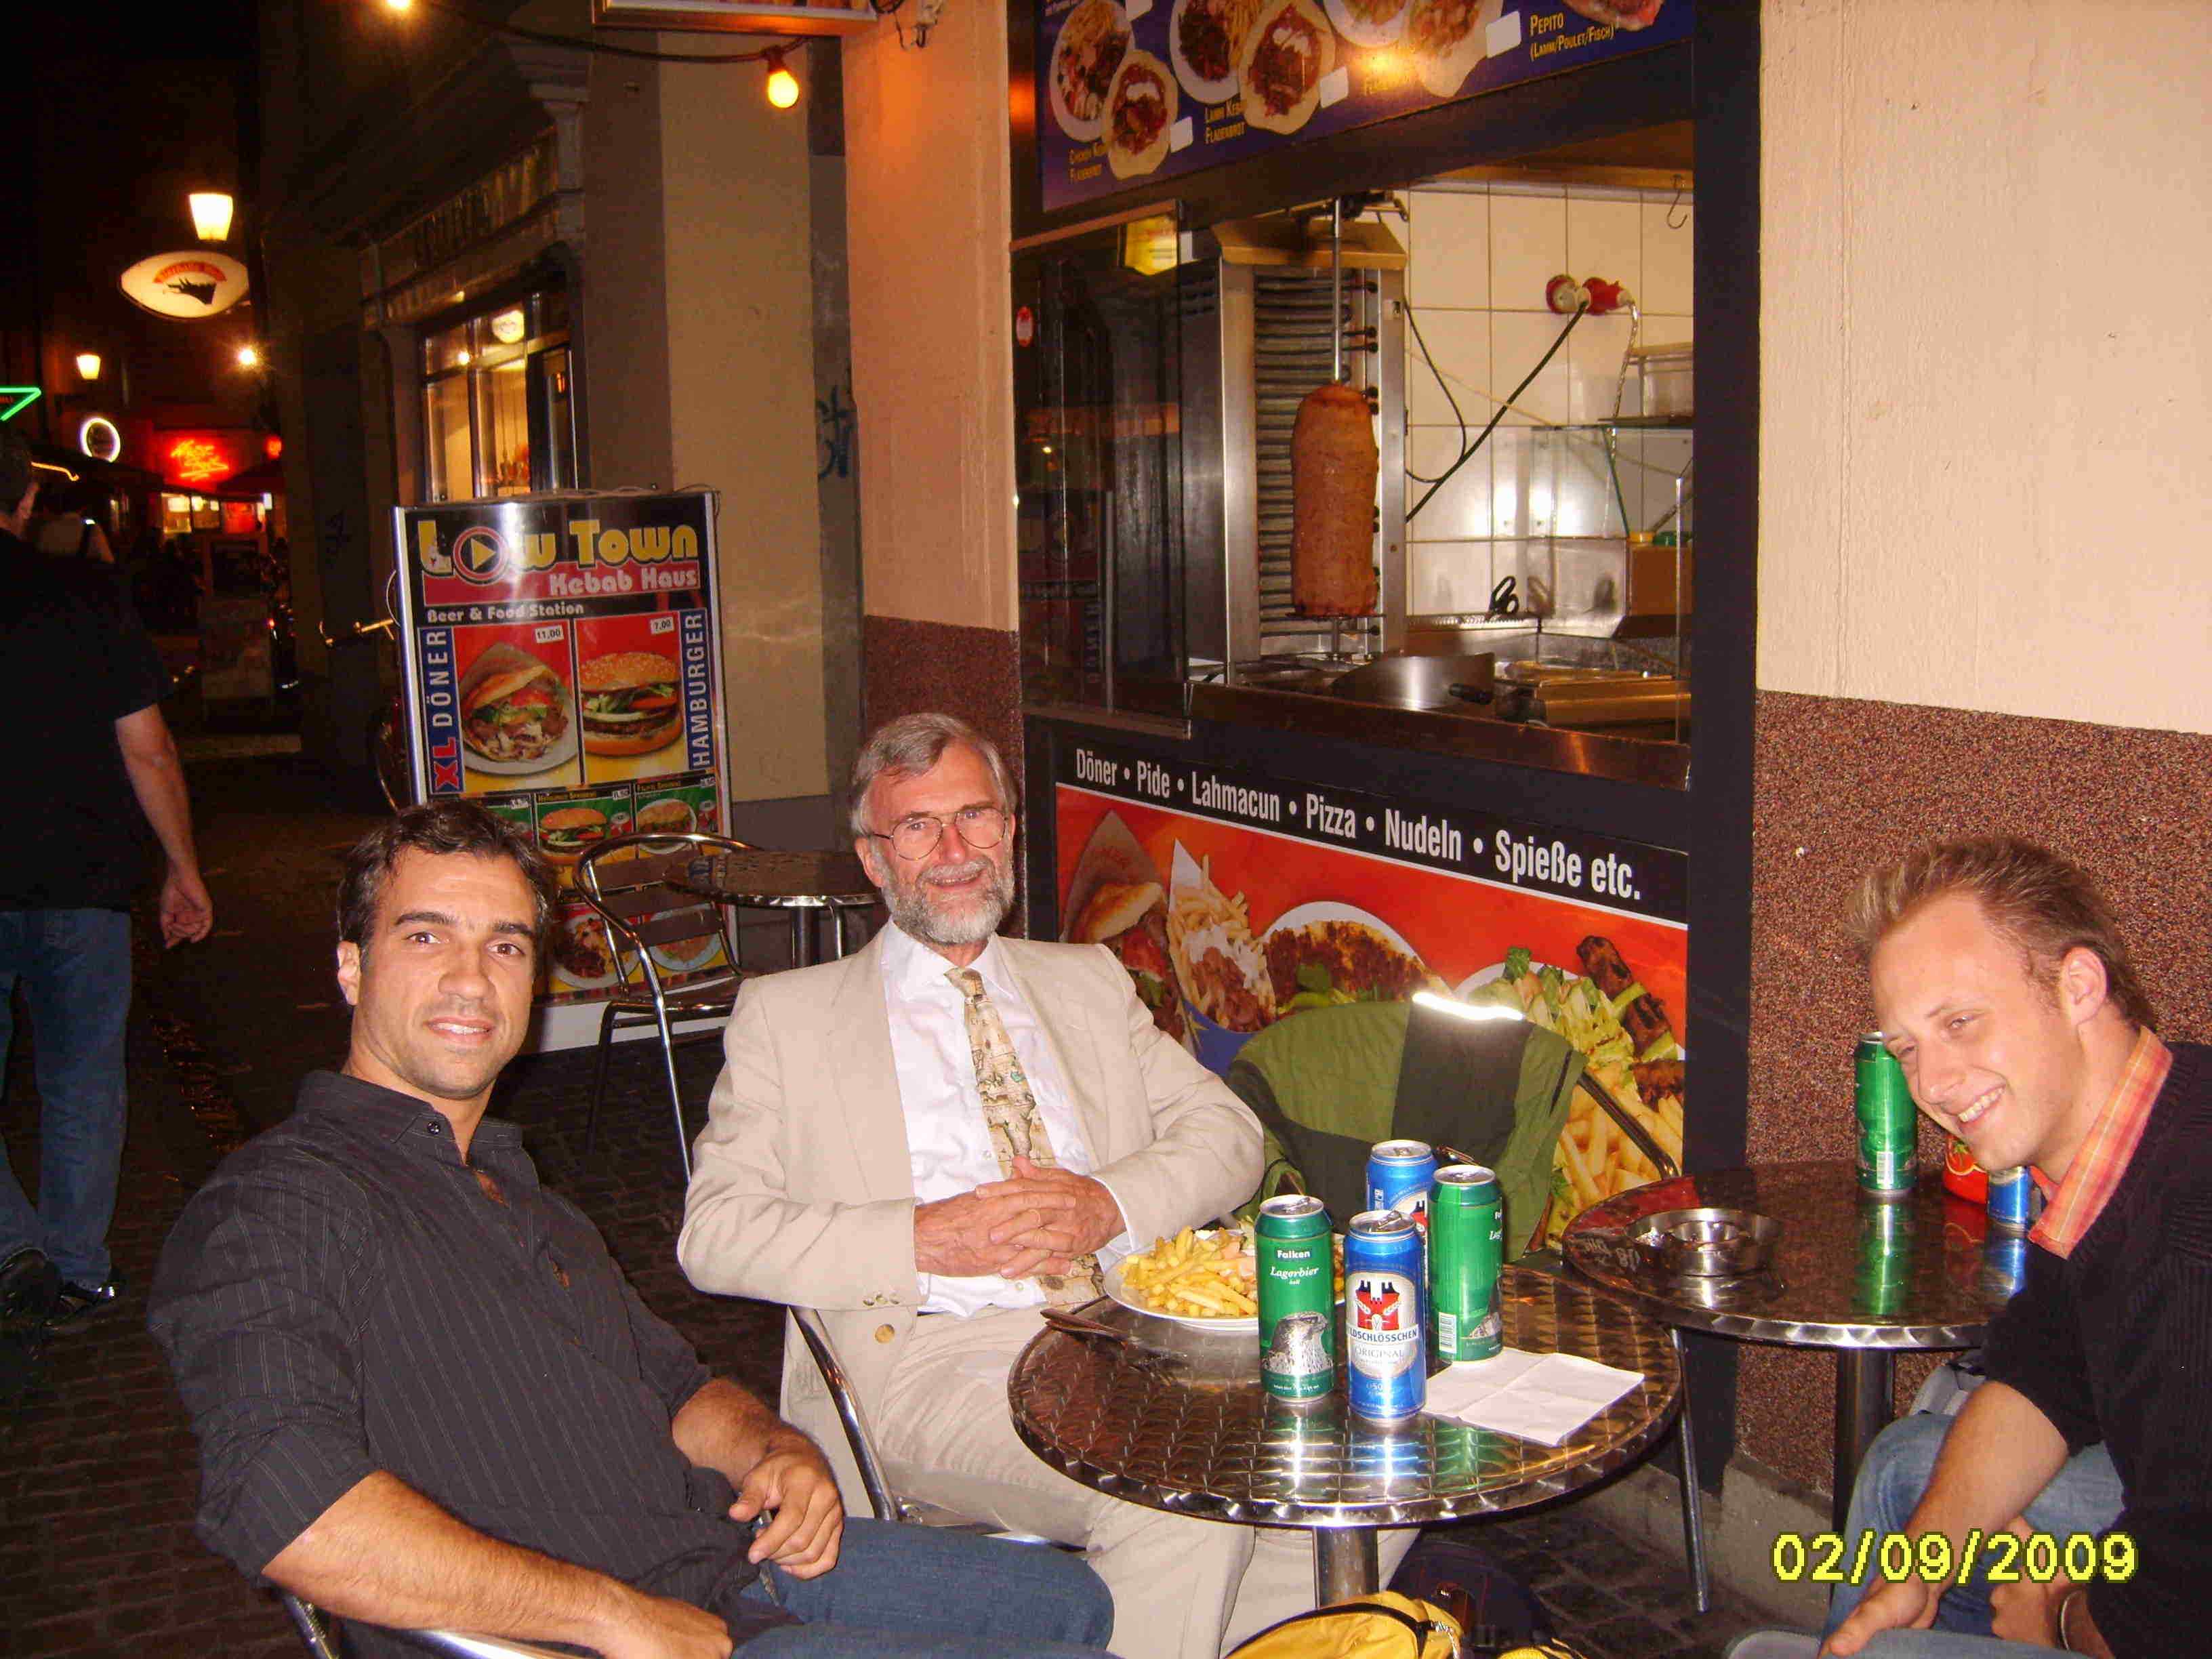
Fig: The Kebab. (from left to right: Me, Ian Evans and my friend Nicolas).
This final contact with such leading researchers of this field of knowledge that I have come to love made me realize what had been so special about that conference. During all five days of conference, be it in the presentations or the workshops, in the keynotes, in the beer-filled meetings, during the thankfully long coffee breaks, when I disturbed them for pictures, when I asked personal questions or when I shook their hands….in all of these situations I felt NO ego whatsoever coming out from anybody. Who would have more right to have an over-developed ego than these men that practically created geomorphometry as it is today and will continue to develop it? Who would have more right to be inaccessible for inexperienced students? Yet they were there talking about their family and eating kebabs with almost total strangers. They were incredibly humble super scientists making beautiful science and inspiring many to follow their path.
I am very grateful for having had the chance to know these men and the only thing I hope is that I am up to the task of honoring them with passionate and true geomorphometry. P.S. 1: Please forgive me if I failed to mention someone or to give enough credit for someone’s work. I could never believe I would be able to write a detailed (and ground-truth) report of what has happened, so please take this manuscript, instead, as a crude version of the truth, but one written with the passion of someone who really admires these men and what their work represents. P.S. 2: I bet no one will ever have a kebab again without thinking of triangles, will you? :)