Blog

Continental Europe Digital Terrain Model at 30 m resolution based on multisource data

Within the OpenDataScience.eu (Geo-harmonizer) project we have recently produced an Digital Terrain Model for Continental Europe based on the four publicly available Digital Surface Models: MERITDEM, AW3D30, GLO-30, EU DEM. This is basically an Ensemble Machine Learning approach where GEDI level 2B points (Level 2A; “elev_lowestmode”) and ICESat-2 (ATL08; “h_te_mean”) were used to train a multisource model to predict “most probable height of terrain” including the prediction errors per pixel.

So which of the four big global DEM’s is the best match with terrain heights? Our results indicate that it is the MERITv1.0.1 (originally available at 90-m, but was downscaled here to 30-m using cubic splines) followed by the AW3Dv2012 and GLO-30. This confirms that Yamazaki et al. (2017) have done an excellent work in filtering out canopy and artifacts in the original SRTM/AWD30 data.

Read more about MERIT DEM in:

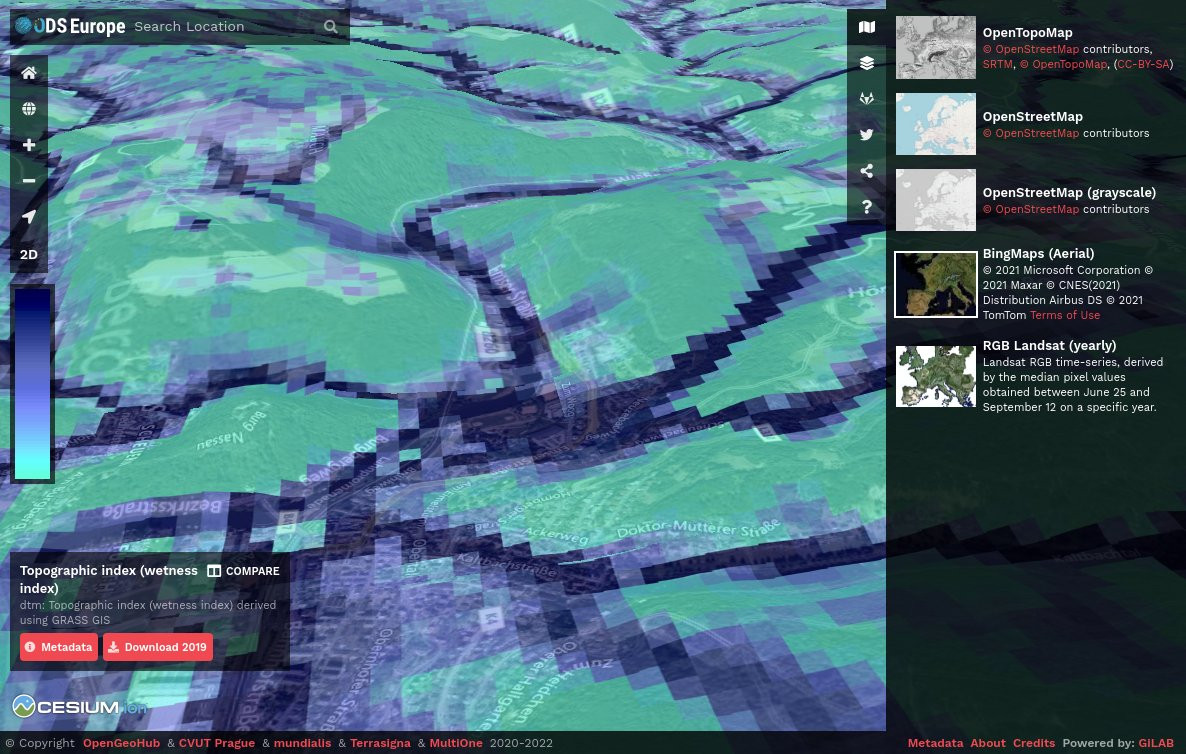
To access the Continental Europe Digital Terrain Model at 30-m please visit https://maps.opendatascience.eu and select “terrain” from the layer menu.

You can also download the DTM for EU including the regression matrix with all training points (GEDI/ICESat) via:

Your opinion on object-based classification of topography - Evaluation still possible!

WEB APPLICATION and QUESTIONNAIRE at http://zgis205.plus.sbg.ac.at/PhysiographicClassificationApplication/default.aspx

Dear colleagues, We kindly ask for your help in evaluating the preliminary outputs of a global physiographic classification. The methodology has been designed for general purposes. We hope, however, that the results can be tuned to specific applications, by using the object attributes, without a need of running the classification again. Potential domains of application include Landscape Ecology, Ecology, Geomorphology, Geology, Hydrology, Soil Science, and Agriculture. Your evaluation would be useful in improving the current classification. The results of your evaluation will be part of a paper we intend to submit to a peer-reviewed journal. Classification results are embedded within a web application available at the following address

http://zgis205.plus.sbg.ac.at/PhysiographicClassificationApplication/default.aspx.

You can visualize the results and let us know your opinion by filling in the form under the red button named ‘Please provide your feedback here.’ Apart of the classification itself, i.e. to which degree classes describe correctly given regions, we would like you evaluating the quality of object boundaries, i.e. to which degree boundaries match topographic discontinuities. After evaluation, both the database and the tool will be released for free download.

Please find below additional details on the methods and the web application.

Methodology

We introduce an object-based method to automatically classify topography from SRTM data. The new method relies on the concept of decomposing land-surface complexity into more homogeneous domains. An elevation layer is automatically segmented and classified at three scale levels that represent domains of complexity by using self-adaptive, data-driven techniques. For each domain, scales in the data are detected with the help of local variance and segmentation is performed at these appropriate scales. Objects resulting from segmentation are partitioned into sub-domains based on thresholds given by the mean values of elevation and standard deviation of elevation respectively. The method is simple and fully automated. The input data consists of only one layer, which does not need any pre-processing. Both segmentation and classification rely on only two parameters: elevation and standard deviation of elevation. Unlike cell-based methods, results are customizable for specific applications; objects can be re-classified according to the research interest by manipulating their attributes. The tool can be applied to any regional area of interest and can also be easily adapted to particular tasks. Both segmentation and class thresholds are relative to the extent and characteristics of the dataset. Therefore, when applying the tool to regional/national levels, the results should be interpreted within the appropriate context (e.g. ‘High Mountains’ that may result from classification of Dutch territory are just the highest and roughest areas relative to this extent). To show the differences, we added the results of classification at the level of the Austrian territory to the web application.

Web application

http://zgis205.plus.sbg.ac.at/PhysiographicClassificationApplication/default.aspx

You will find the following layers:

  1. Global_Level3. This is the finest scale at the global level. Object boundaries are transparent to enhance visualization at full extent;

  2. GlobalLevel_objectsEvaluation. This is the same layer as above, with object boundaries on. It helps in evaluating the match with land-surface discontinuities;

3-5. Results of classification of the Austrian territory at all scale levels;

  1. Country Boundaries - for orientation;

  2. ESRI_ShadedRelief - to visualize topography. Please be aware that this classification was obtained form SRTM data at approximately 1 km resolution, while the shaded relief map is much finer in some areas (see http://server.arcgisonline.com/ArcGIS/rest/services/ESRI_ShadedRelief_World_2D/MapServer). Therefore, some discrepancies might be apparent.

For each layer, except for the 7th, objects can be selected using the info button. After activating it, click within a polygon: a pop-up window will display the class label of the polygon, as well as its attribute table. Click on ‘Add to results’ at the bottom of the pop-up window: the polygon is selected. The attributes are presented in the table below; for details and equations see the eCognition Reference Book.

The following eleven attributes are listed for each object:

  • Area_Pxl: Area in pixels. 1 pixel is approximately 1sq km
  • Asymmetry: Relative length compared to a regular polygon
  • Compactness: Product of length and width, divided by the number of pixels
  • Elliptic_F: Elliptic fit. Describes how well an image object fits into an ellipse of similar size and proportions.
  • LengthWidt: Length/Width ratio of an image object
  • Local_Reli: Ratio. Max elevation minus Min elevation within a polygon
  • Mean_Layer: Mean elevation of cells within a polygon
  • Roundness: Describes how similar an image object is to an ellipse. It is calculated by the difference of the enclosing ellipse and the enclosed ellipse.
  • Shape_inde: Shape index. Describes the smoothness of a polygon border
  • Skewness_L: Skewness of elevation (based on cells within a polygon)
  • Standard_d: Standard deviation of elevation (based on cells within a polygon)

Thank you for your help!

GDEM - a quick assessment

The first 30 m resolution global ASTER-based DEM (GDEM) has recently been released. This is now the most detailed global GIS layer with public access (read more). The GDEM was created by stereo-correlating the 1.3 million-scene ASTER archive of optical images, covering almost 98% of Earth’s land surface (claimed 95% vertical accuracy: 20 meters, 95% horizontal accuracy: 30 meters). The one-by-one-degree tiles can be downloaded from NASA’s EOS data archive and/or Japan’s Ground Data System. The download of DEMs for large areas is at the moment difficult and limited to 100 tiles.

I have downloaded some GDEM tiles for the areas in the Netherlands, Italy, Serbia and USA, and compared these with the most accurate LIDAR-derived DEMs (aggregated to 25 m resolution) available for the same area. The data used for comparison and shown in plot below can be obtained from here. I was interested to see how accurate is the GDEM and what are the main limitations of using it for various mapping applications.

Conceptually speaking, accuracy of topography (or better to say relief) can be represented by examining (at least) the following three aspects of a DEM:

  • Accuracy of absolute elevations (simply the difference between the GDEM and true elevation);
  • Accuracy of hydrological features (deviance of stream networks, watershed polygons etc. from true lines);
  • Accuracy of surface roughness (deviance of the nugget variation and/or difference in local relief quantified using e.g. difference from the mean value);

Fig: Comparison of the GDEM and LiDAR-based DEMs for four study areas: (1) fishcamp; (2) zlatibor; (3) calabria, and (4) boschord (all maps prepared in resolution 25-30 m).

The results of this small comparison show that:

  1. The average RMSE for elevations for these for data sets is: 18.7 m;
  2. The average error of locating streams is between 60-100 m;
  3. Surface roughness is typically under-represented so that the effective resolution of GDEM is possibly 2-3 times coarser than the actual;

In addition, by visually comparing DEMs for the four case studies, you will notice that GDEM often carries some artificial lines and ghost-like features (GDEM tiles borders, vegetation cover etc.). The worst match between the GDEM and LiDAR-based DEM (reality) is in areas of low relief (boschord). Practically, GDEM looks to be of absolutely no use in areas where the average difference in elevations is <20 m. As the producers of GDEM themselves indicated: “The ASTER GDEM contains anomalies and artifacts that will reduce its usability for certain applications, because they can introduce large elevation errors on local scales”.

In summary, I can only conclude that (a) there is still a lot of filtering to be done with GDEM to remove the artificial breaks and ghost lines; (b) the effective resolution of the GDEM is probably 60-90 m and not 30 m, hence the whole layer should be aggregated to a more realistic resolution; (c) the first impression is that GDEM is not more accurate than the 90 m SRTM DEM, especially if one looks at the surface roughness and land surface objects. On the other hand, the horizontal accuracy of GDEM is more than satisfactory and GDEM has a near to complete global coverage, so that it can be used to fill the gaps and improve the global SRTM DEM. In addition, the GDEM comes also with a quality assessment (QA) map. Each QA file pixel contains either: (1) the number of scene-based DEMs contributing to the final GDEM value for each 30 m pixel (stack number); or (2) the source data set used to replace identified bad values in the ASTER GDEM.

Important info Geomorphometry 2009

Dear Geomorphometry Participants,

Geomorphometry 2009 is getting closer, and this post contains important information with respect to the conference. All of this information, together with maps and a programme is also in the attached PDF, so as to provide a printable set of information.

Arrival and Travel in Zurich

Most of you will either arrive by train or plane. If you are staying near the University, then the easiest way to travel from the airport is to take a Tram (10) from outside the airport building. Follow the signs through the terminal and the airport shopping centre to find the tram stop. For all other locations, it is simplest to take a train to Zurich HB (the main station). In both cases you need a 1-way ticket to the city, which you can buy from machines or people at the airport railway station and tram stop. Always travel with a ticket – inspections are frequent, and not speaking German won’t save you from an expensive fine. In town, the cheapest way to get around is with a Tageskarte – a 24 hour ticket valid from the time of purchase for the whole city for the next 24 hours. These cost 8.00 SFr and can be used on trains, buses, trams and even boats inside Zone 10. Note that the airport is not in Zone 10! You can find a Zurich travel network plan. Trams are every 10 minutes or so. Weather The weather in Zurich is changeable. So, plan for it hopefully being warm and sunny, but possibly also being rainy and cold! Our conference dinner venue will involve some walking, whatever the weather.

Conference Registration

Registration will be open on Monday, 31st August from 8.30. The attached map shows the route from the Irchel and Milchbuck tram stops to the registration desk, which is adjacent to the lecture theatre where the single conference track will take place.

Conference Events and Facilities

There will be a Welcome Apéro on Monday evening (drinks and snacks) and the conference dinner will be on Tuesday evening. The conference dinner will be traditional Swiss food, with a vegetarian option, in a restaurant in the nearby hills. Travel there will be by public transport, and we will travel there together. During the conference there will be two coffee breaks per day and lunch will be in the University Mensa, using tickets that you will receive on registration. There will be wireless access to the Internet in the University buildings, through accounts which we will provide on arrival.

Workshops

If you have signed up for a workshop, you will receive detailed information about your workshop separately in August.

Conference Programme

A provisional conference programme is available here. We are delighted to have 3 keynote speakers, as well as an exciting programme of conference talks. Information for Presenters All talks have a slot of 25 minutes, including questions and changeover. Thus, we plan to use a single machine for all talks. This machine will have Internet access, Powerpoint 2003, and Adobe Acrobat installed. If you have other, special requirements, please let us know in advance. We will gather talks before each session at the registration desk for installation and testing. If you have any questions about the conference then please don’t hesitate to contact us.

We look forward to meeting you in Zurich.

Best wishes,

Ross Purves, Stephan Gruber and Ralph Straumann Local organisers

map of events

Geomorphometry_final_ann

Geomorphometry 2021 - Conference Registration

Website registration

Registration to the website (getting your website account) is needed to register to the Conference.

Upon registering online you must choose a Username and a Password and provide few personal information. This initial registration will enable you to surf the site, keep track of the status of your registration, register to the conference, pay the registration fees, just to name a few.

Go to LOGIN form

Conference Registration

The registration to the the Conference is subject to the payment of the following fees

In Presence

  • Full registration: € 150
  • Full on-site registration: € 200
  • 1-Day registration: € 100

Online

  • Full registration: € 50 (Please read below about credit card payments with Mastercard)

The registration fees entitles you to:

  • Admittance to Geomorphometry 2021 Events including the Technical Workshops
  • Access to the electronic proceedings

No other serviceis included

Payment

To pay for the Registration Fees you may use the following methods of payment:

1) Bank Transfer; If you wish to pay by bank transfer, before making it out, please go to the Geomorphometry eShop and go through the purchase process selecting the Bank Transfer payment method. At the end of the process you will be assigned an Order ID that must be returned in the “Reason for payment” of your transfer so that the payment verification operations are faster and accurate.

Account owner: T4E Srl

Owner address: Via Dalmazio Birago 18 06124 Perugia Italy

IBAN International Bank Account Number: IT88V0707503007000000615175

BIC swift Bank Identification Code: ICRAITRRTV0

Bank name: Banca Centro - Credito Cooperativo Toscana - Umbria

Bank address: Via Martiri dei Lager 06128 Perugia Italy

2) Credit Card; Only VISA and Mastercard (please note that, as of September 10, Mastercard is experiencing problems in the last few days and if you have 3D SecureTM control enabled you won’t be able to use your card) circuits are accepted and we would like to inform you that your paymnet may require the credit card 3D Secure™ (or 3DS) authentication code.

More over, please make sure to allow pop-ups and redirects from https://payway.sinergia.bcc.it which is the address of the secure server of our bank

The 3D Secure™ is a secure online payment service. The authentication procedure is simple and involves 3 steps.

  • Place your order and enter your debit or credit card information.
  • If the security system is activated for your card, a 3D Secure™ window will open. Your bank or CC circuit will ask you to verify your identity by entering an authentication code. In most cases, this is a single-use security code that is sent to you by SMS on your mobile phone.
  • Once you enter the correct security code your payment is accepted. The 3D Secure™ payment system is available through your bank under the name “Verified by Visa” for Visa cards or “Mastercard SecureCode” for Mastercard cards.

3) Cash (on-site only). On-site cash payments can be made out only in Euro.

Latest Posts

ANADEM: A Digital Terrain Model for South America

There is a new paper (open access) describing a Machine Learning-based DTM for South America:

Laipelt L., Andrade B.C., Collischonn W., Teixeira A.A., Paiva R.C.D., Ruhoff A., 2024. ANADEM: A Digital Terrain Model for South America. Remote Sensing 16(13):2321. https://doi.org/10.3390/rs16132321

GRASS GIS 8.4.0RC1 release

The GRASS GIS 8.4.0RC1 release provides more than 515 improvements and fixes with respect to the release 8.3.2.

Check the full announcement at https://github.com/OSGeo/grass/releases/tag/8.4.0RC1.

Please support in testing this release candidate.

Best BiCubic Method to Compute the Planimetric Misregistration between Images with Sub-Pixel Accuracy: Application to Digital Elevation Models

There is a new paper (open access) describing a novel method to estimate sub-pixel planimetric displacements between two DEMs:

Riazanoff, S.; Corseaux, A.; Albinet, C.; Strobl, P.A.; López-Vázquez, C.; Guth, P.L.; Tadono, T. Best BiCubic Method to Compute the Planimetric Misregistration between Images with Sub-Pixel Accuracy: Application to Digital Elevation Models. ISPRS Int. J. Geo-Inf. 13, 96. https://doi.org/10.3390/ijgi13030096